R for R Users
Part 1: R Workflows
The scenario
You inherited a script
Sam, a graduate student on your research team, just graduated and left for a new job, leaving an ongoing project to pass to you. Their analysis is “done.” You get an email:
“Here’s the script. It definitely works, just run it! The data’s attached, plus the Table 1 doc I’ve been updating. Good luck! – Sam”
Attached: final_analysis_FINAL_v2.R, births.csv, and Table1_DRAFT_manuscript.docx.
You open it and start running
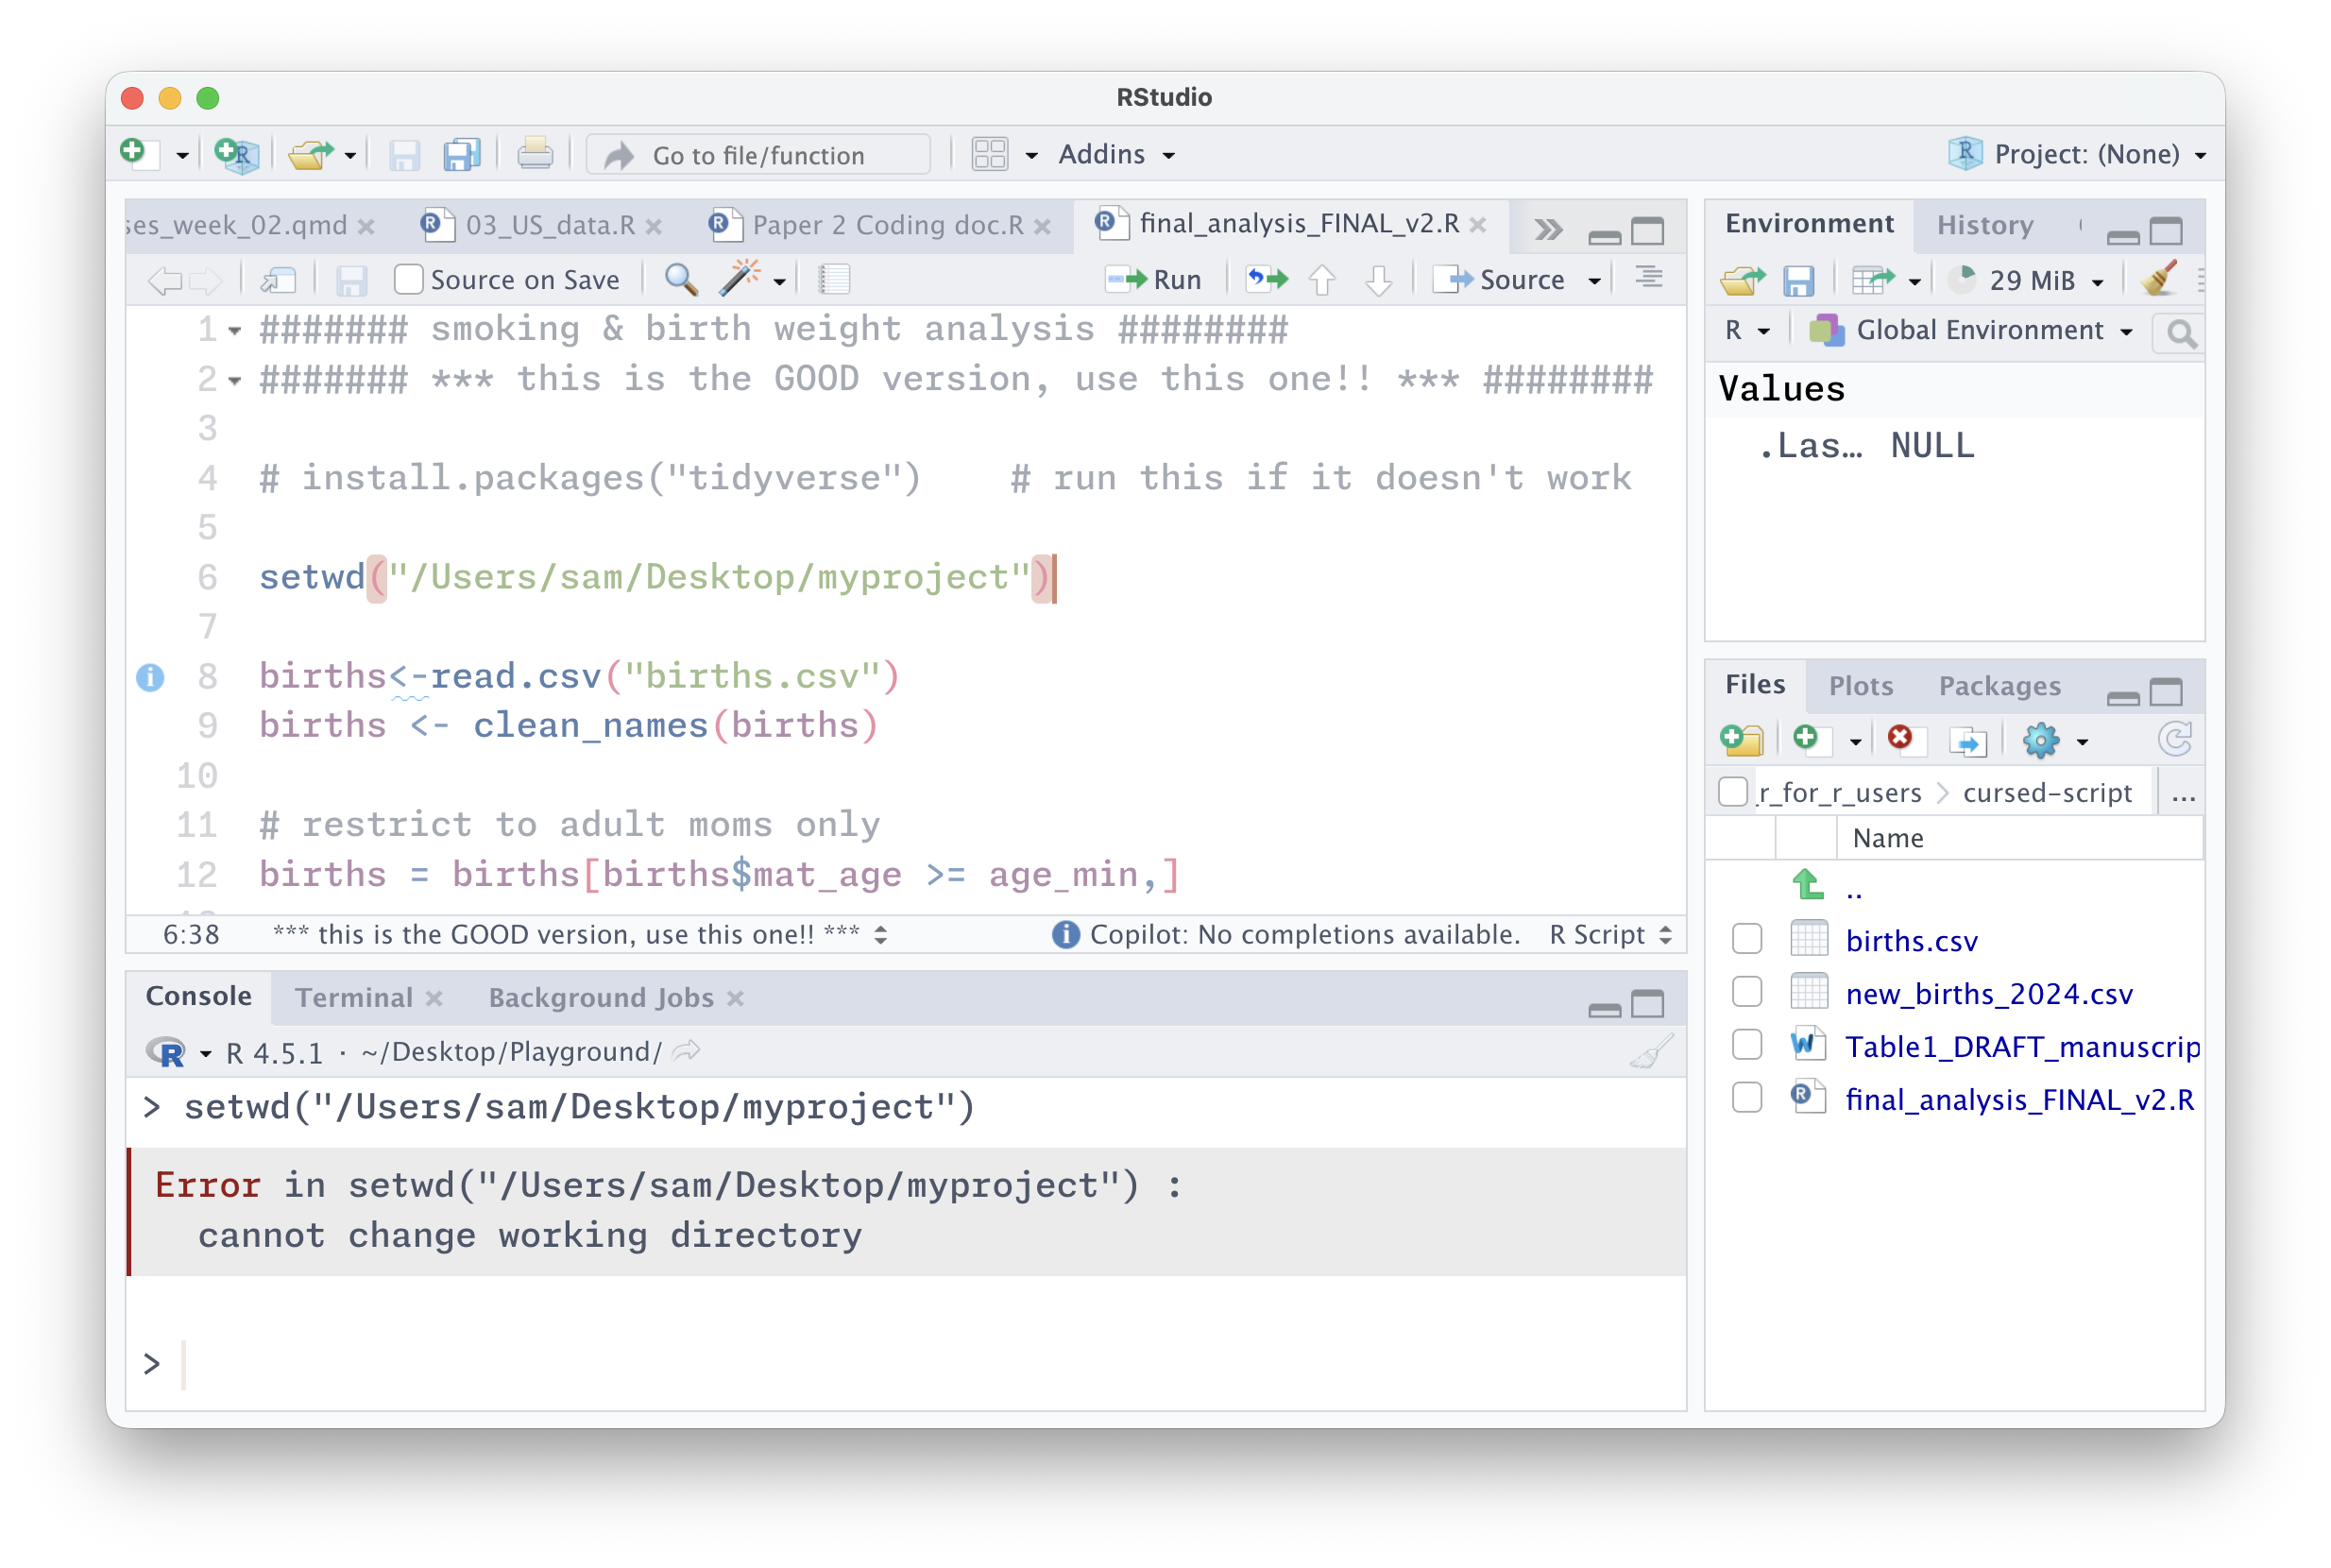
Most of us have written a script like this
Today we’ll cover good R practices to avoid leaving any of your colleagues – and possibly most importantly, your future self – in this position
What Part 1 covers
- Projects + paths –
here() - Blank-slate R – why “it works on my machine” happens
- Reproducibility – code that runs in order, every time
- Code style – readable code, and formatters that do it for you
- Organizing & scaling – scripts → Quarto →
targets
Two editors, same ideas
We’ll work in RStudio today – it’s probably what you already use and it’s great
But I’ll also mention Positron: Posit’s newer editor, built on VS Code. Multi-language (including R and Python), more extensible, and has some things we’ll discuss built in
Projects
The first line already broke
Error in setwd(“/Users/sam/Desktop/myproject”) :
cannot change working directory
Do you think this code from 2015 still runs?
A researcher doing a meta-analysis reached out years later for some data…
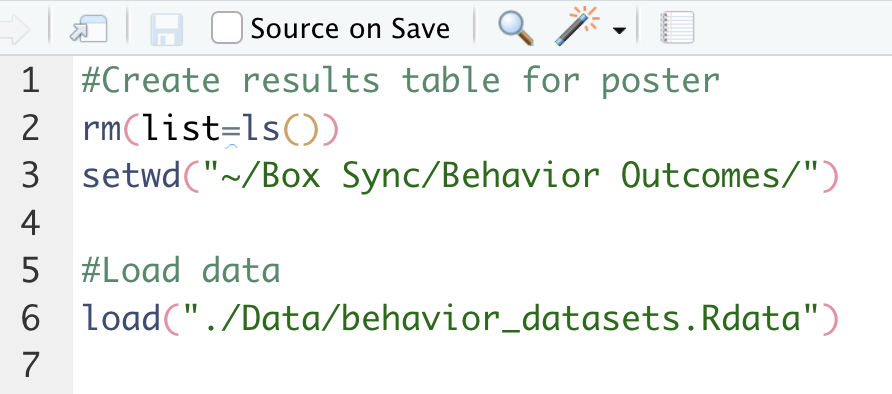
The problem with setwd()
setwd() points at one exact folder on one exact computer. The moment the project moves – a new laptop, a shared drive, your machine – it will break
Note
A classic explainer: https://www.tidyverse.org/blog/2017/12/workflow-vs-script/
Better: an R Project
my-project/
├─ my-project.Rproj
├─ README.md
├─ data/
│   ├─ raw/
│   └─ processed/
├─ R/
└─ results/
    ├─ figures/
└─ tables/- The
.Rprojfile marks the project root and opens RStudio in that folder – nosetwd()needed- It stores some settings but you never need to edit it by hand
- Positron doesn’t use
.Rprojfiles, instead opening the folder as a project – but the idea is the same
- If you share the project folder (e.g. GitHub, Dropbox, zipping and emailing), it will set the working directory wherever it’s saved
Always open a project by opening the .Rproj file
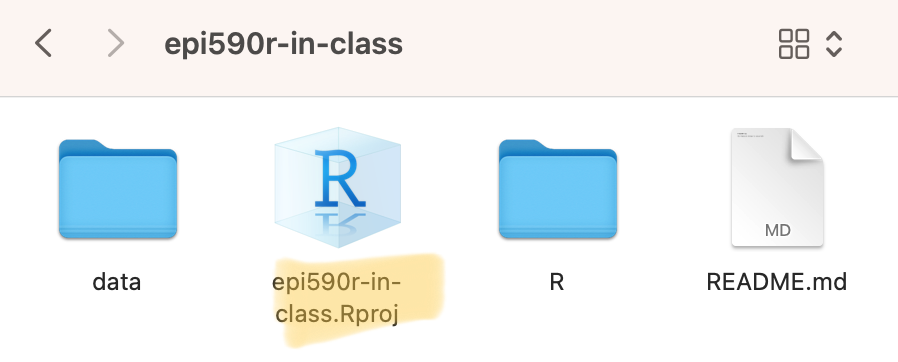
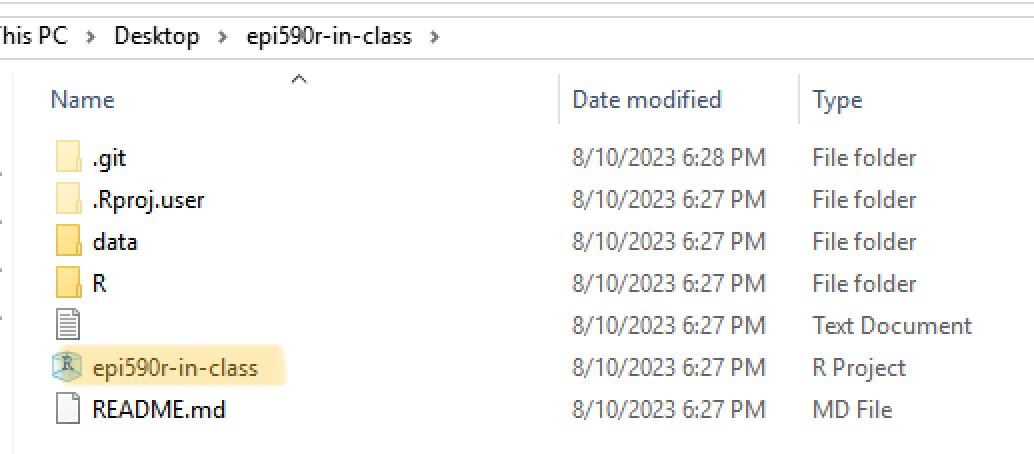
You can have multiple projects open at once in different RStudio sessions!
You can also switch between R projects from RStudio
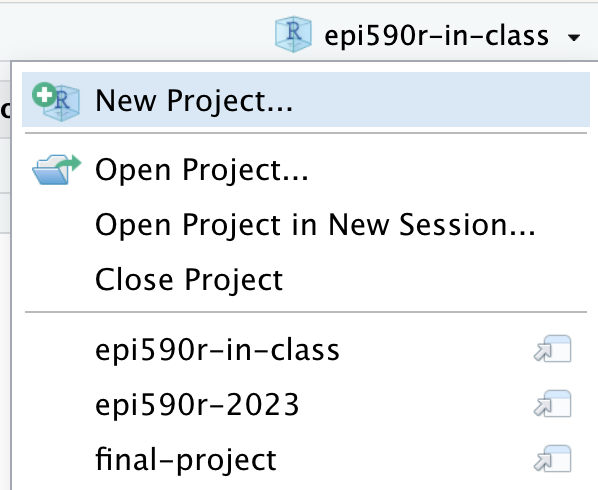
- Clicking the arrow icon will open it up in a new session and keep your current session open
- Opening an R project will also open all the files you had open last time (including unsaved “Untitled” files!)
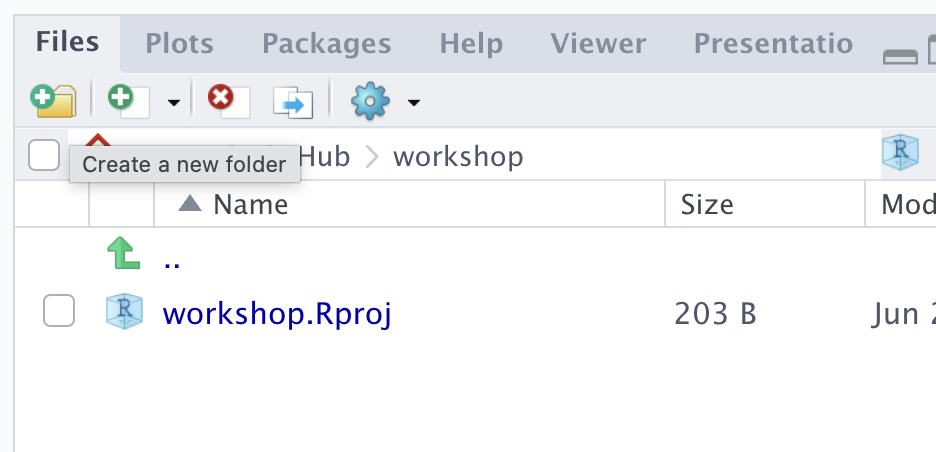
Set up the project
- Start a new R project (File → New Project → New Directory → New Project., or use the upper-right-corner drop-down)
- Add a
datafolder (either through RStudio or your file explorer) - Move the files from Sam into the appropriate places in the project folder
File paths
The good news is that this runs now!
The bad news is that there are still ways it might break (e.g., depending on your settings, if you are trying to read it in from an R Markdown or Quarto document in a subfolder)
Error in file(file, “rt”) : cannot open the connection
In addition: Warning message:
In file(file, “rt”) :
cannot open file ‘data/births.csv’: No such file or directory
Paths that travel: the here package
here() builds paths from the project root – the folder with the .Rproj.
- On my machine
here("data/births.csv")becomes my full path (i.e.,/Users/l.smith/.../myproject/data/births.csv); on yours it becomes yours - This conversion into a full path rather than relative path means that it will work even in a Quarto document compiling in a subdirectory
How to use here()
You can nest as many directories as exist in the path, and slashes are always forward:
here::here() vs library(here)
is the same as
Note
You can do this with any function from any package (we’ll see another example in a bit)
Start rewriting the script
Save a new, better version to work on.
- Delete the
setwd()line, and rewrite theread.csv()line to usehere()- You might need to
install.packages("here")first
- You might need to
- Run that line to make sure you can read in the data!
Blank-slate R
Your R session is full of invisible state
While you work, R quietly accumulates:
- objects you’ve created
- packages you’ve loaded
- a working directory
A script doesn’t make this explicit will run for you, today, and break for anyone else – including future you
Hidden state
Sam’s script restricts to adult mothers:
####### smoking & birth weight analysis ########
####### *** this is the GOOD version, use this one!! *** ########

# install.packages("tidyverse")    # run this if it doesn't work

setwd("/Users/sam/Desktop/myproject")

births<-read.csv("births.csv")
births <- clean_names(births)

# restrict to adult moms only
births = births[births$mat_age >= age_min,]
Error: object ‘age_min’ not found
Error: object not found
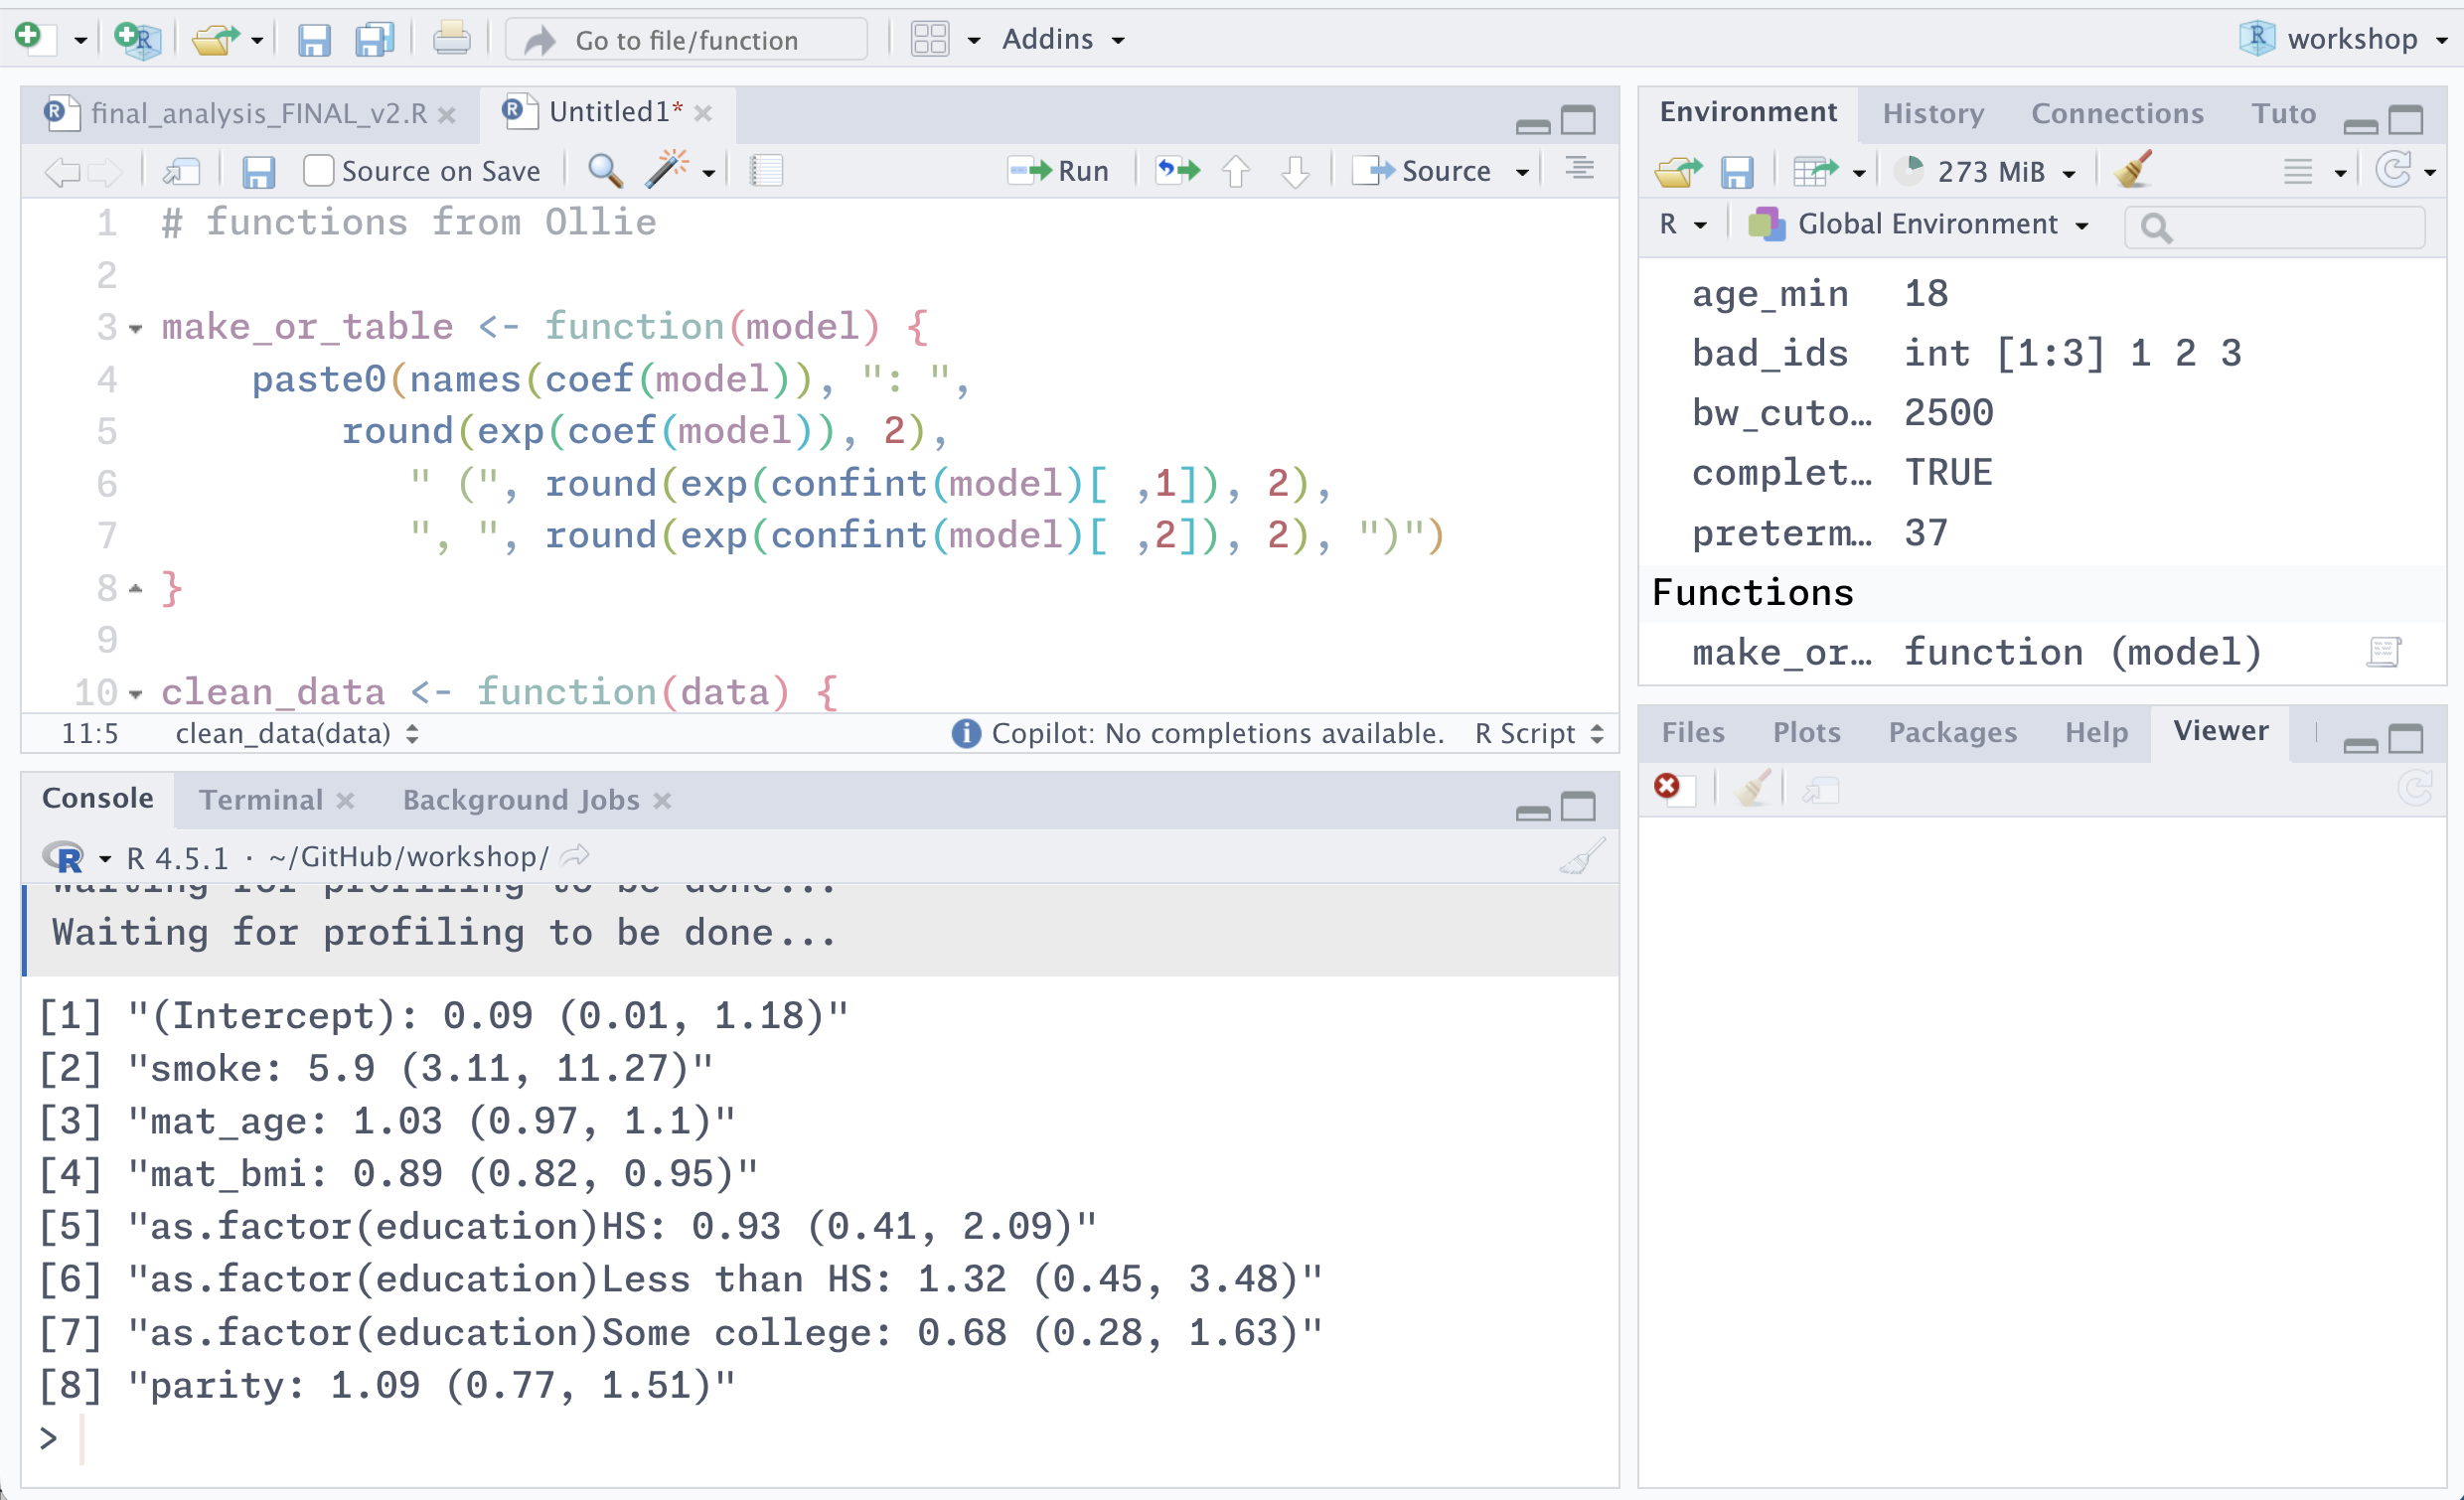
Where does age_min come from? It’s never defined in the script. Sam typed age_min <- 18 in the console months ago, and it’s been sitting in their environment ever since.
This is hidden state – the analysis depends on something that isn’t in the code.
This is also common when you are not running code top-to-bottom – this will error in a new session if age_min is defined below the code where it’s used.
And it’s not just objects
The same trap catches functions:
Error in clean_names(births) : could not find function “clean_names”
If a package was loaded in Sam’s session but library() never made it into the script, or a helper function was defined in the console or by running code from a new script, your clean session has no idea what you mean.
What Sam might have been doing…
Packages
base, methods, datasets, utils, grDevices, graphics, stats are all loaded by default
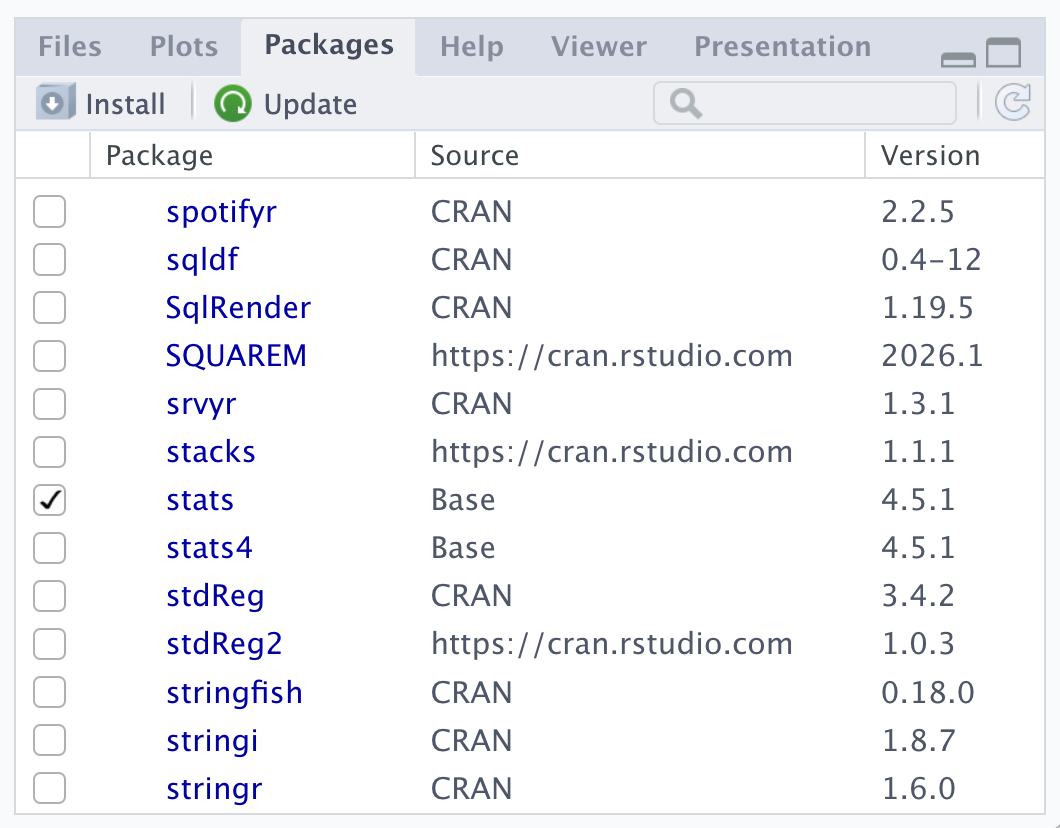
You can use the packages pane to see what packages you have loaded or their versions, but don’t load them this way – make sure to library() them in your script so anyone else can run it too
Referring to functions from packages
Works because janitor is loaded:
Works without loading all janitor functions, which is fine if this is all you need:
But another janitor function, like get_dupes(births) will error
Quick tip
Error: object ‘Age_Min’ not found
Error in clean.names(births) : could not find function “clean.names”
You are also going to get these same errors if you spell something wrong, so check for typos before going on a wild goose chase for hidden state! Similarly:
Warning message: package ‘jantor’ is not available for this version of R
A version of this package for your version of R might be available elsewhere, see the ideas at https://cran.r-project.org/doc/manuals/r-patched/R-admin.html#Installing-packages
Start every session empty
Tell R to never save or restore your workspace:
- Tools → Global Options → General
- Uncheck “Restore .RData into workspace at startup”
- Set “Save workspace to .RData on exit” → Never
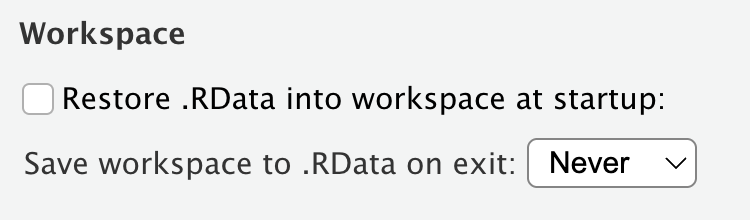
(In Positron, this is automatic!)
rm(list = ls()) is not a clean slate
You’ll see scripts open with this to “clear everything”:
It deletes objects – but it does not unload packages, reset options, or change the working directory. It’s a false sense of safety.
Tip
The real reset: Session → Restart R (Cmd/Ctrl + Shift + F10). Do it early and do it often. (I actually map my keyboard shortcut to Cmd + Shift + R so it’s easier to reach/I remember it!).
attach()
Sam’s script does this:
attach() dumps a copy of every column into your search path so you can type birth_weight instead of births$birth_weight. Tempting. Avoid!
Why attach() goes wrong
The attached copy is a snapshot. Edit births and the attached birth_weight is now stale – you’re working with two versions and won’t be told which.
- attach two datasets with a shared column name and one silently masks the other
- forget to
detach()and the clutter follows you all session
Refer to columns explicitly (births$x, or with(), or stay inside dplyr functions).
Hunt the hidden state
Sam’s environment was full of things the script quietly depends on. Find as many as you can:
- objects used but never defined in the script
- functions called but never defined
- packages used but never loaded with
library()
Just make a list for now – we’ll fix them next.
Reproducibility
Code runs in the order it’s written
…not the order you happened to run things in. Sam’s script draws a figure near the top:
Same story with packages
The library() call exists – it’s just in the wrong place. In Sam’s session the package was already loaded, so the figure ran. In a fresh session it errors: could not find function "ggplot".
Load every package at the top.
The fix is just… order
A script should read top to bottom like a recipe.
For example: load → read → clean → model → report.
Reproducible = re-runnable from scratch
A reproducible analysis can be re-run from nothing and give the same result – by you, by a reviewer, by you in two years.
That needs:
- self-contained paths (
here()), - a clean session (no hidden state),
- code in runnable order
Make it run, start to finish
- Move
library()calls to the top; move the figure after the data it plots. - Fix the hidden state you found previously (define the objects, load the packages, replace Sam’s helper).
- set
min_ageto 18,bad_idsto 1:3,bw_cutoffto 2500, and replacemake_or_table()withtidy()
- set
- Restart R (
Cmd/Ctrl + Shift + F10) for a clean slate. - Run the whole script top to bottom. Read the first error, fix it, repeat until you get rid of as many errors as you can.
Code style
Style is for humans
The code runs either way. Style is what makes it readable, reviewable, and hard to break – by collaborators, reviewers, and future you.
This is separate from code that’s wrong or unsafe. We’re talking about formatting and naming here, not correctness.
Ugly, unreadable code
This is painful to look at and difficult to understand. One line, three statements, cryptic names, no spaces, mixed assignment.
Instead you might write:
More bad habits
# inconsistent naming, spacing, and assignment
MatAge <- d$mat_age
birth.weight<-d$birthWeight
n_Obs = nrow( d )

# magic numbers with no explanation
d <- d[d$v3 > 2500 & d$v7 < 37, ]

# the commented-out graveyard
# m1 <- lm(y ~ x)
# m2 <- lm(y ~ x + z)
# m3 <- lm(y ~ x + z + w)   # this one? maybe?

# T/F abbreviations
T <- 34
if (x == T) {...}
Habits worth considering
- One statement per line; let long calls breathe across lines
- Spaces around operators:
x + 1, notx+1 <-for assignment (the tidyverse convention), reserve=for arguments- Consistently cased names that mean something
- Indent nested code; delete dead commented-out code (save in separate file?)
- Keep lines short enough to read without scrolling
Note
Reference: https://r4ds.hadley.nz/workflow-style
Don’t do it by hand – use a formatter
styler (R package)
- RStudio → Addins → Style active file
- or
styler::style_file("script.R") - https://styler.r-lib.org
Air (newer, very fast)
- Format-on-save in your editor
- Built into Positron
- Install for use in RStudio: https://posit-dev.github.io/air/editor-rstudio.html
- (can’t use in Quarto documents in RStudio yet)
Clean it up
- Install and run
styler::style_file()on your script (Addins → Style active file), or install Air and format document. - Compare before and after!
- Now fix what a formatter won’t: cryptic names, magic numbers, anything else that’s not aesthetically pleasing to you!
Organizing & scaling
One script that does everything
Sam’s script reads, cleans, plots, models, and saves – all in one file, top to bottom. For a small analysis, honestly, that’s fine!
The strain shows up as it grows:
- you scroll forever to find the code you’re looking for
- re-running the figure means re-running the slow cleaning code too
- two people can’t edit it without colliding
There’s no single right answer. Here are four options, lightest to heaviest – pick what works for you
1. Numbered scripts + a runner
R/00_setup.R     # packages, options, source functions
R/01_clean.R     # raw data  ->  analysis data
R/02_analysis.R  # fit models
R/03_outputs.R   # tables, figures
run_all.R        # source() them in order
A great default for many projects
2. One Quarto document
Everything – cleaning, models, write-up – in a single .qmd.
Makes a lot of sense when the analysis is the deliverable: a report, a paper, a homework assignment. It also encourages good habits.
Why Quarto?
- Every time you render, you are running the whole analysis in a clean session – no hidden state, no out-of-order code
- Inline code means numbers never go stale:
Sample size was n = `r nrow(births)` - Same with tables and figures – avoid copy-pasting
- Easy to share; lots of cool output formats (HTML, Word, PDF, slides, dashboards, books, websites)
Note
Familiar with R Markdown? You can use basically everything you know about R Markdown in Quarto, and more!
3. A Quarto report, assembled from sections
A parent document pulls in section files.
Good when a document gets unwieldy, or co-authors each own a section without scrolling through the whole manuscript.
Note
This is similar to how I wrote my dissertation (with R Markdown)!
4. A targets pipeline
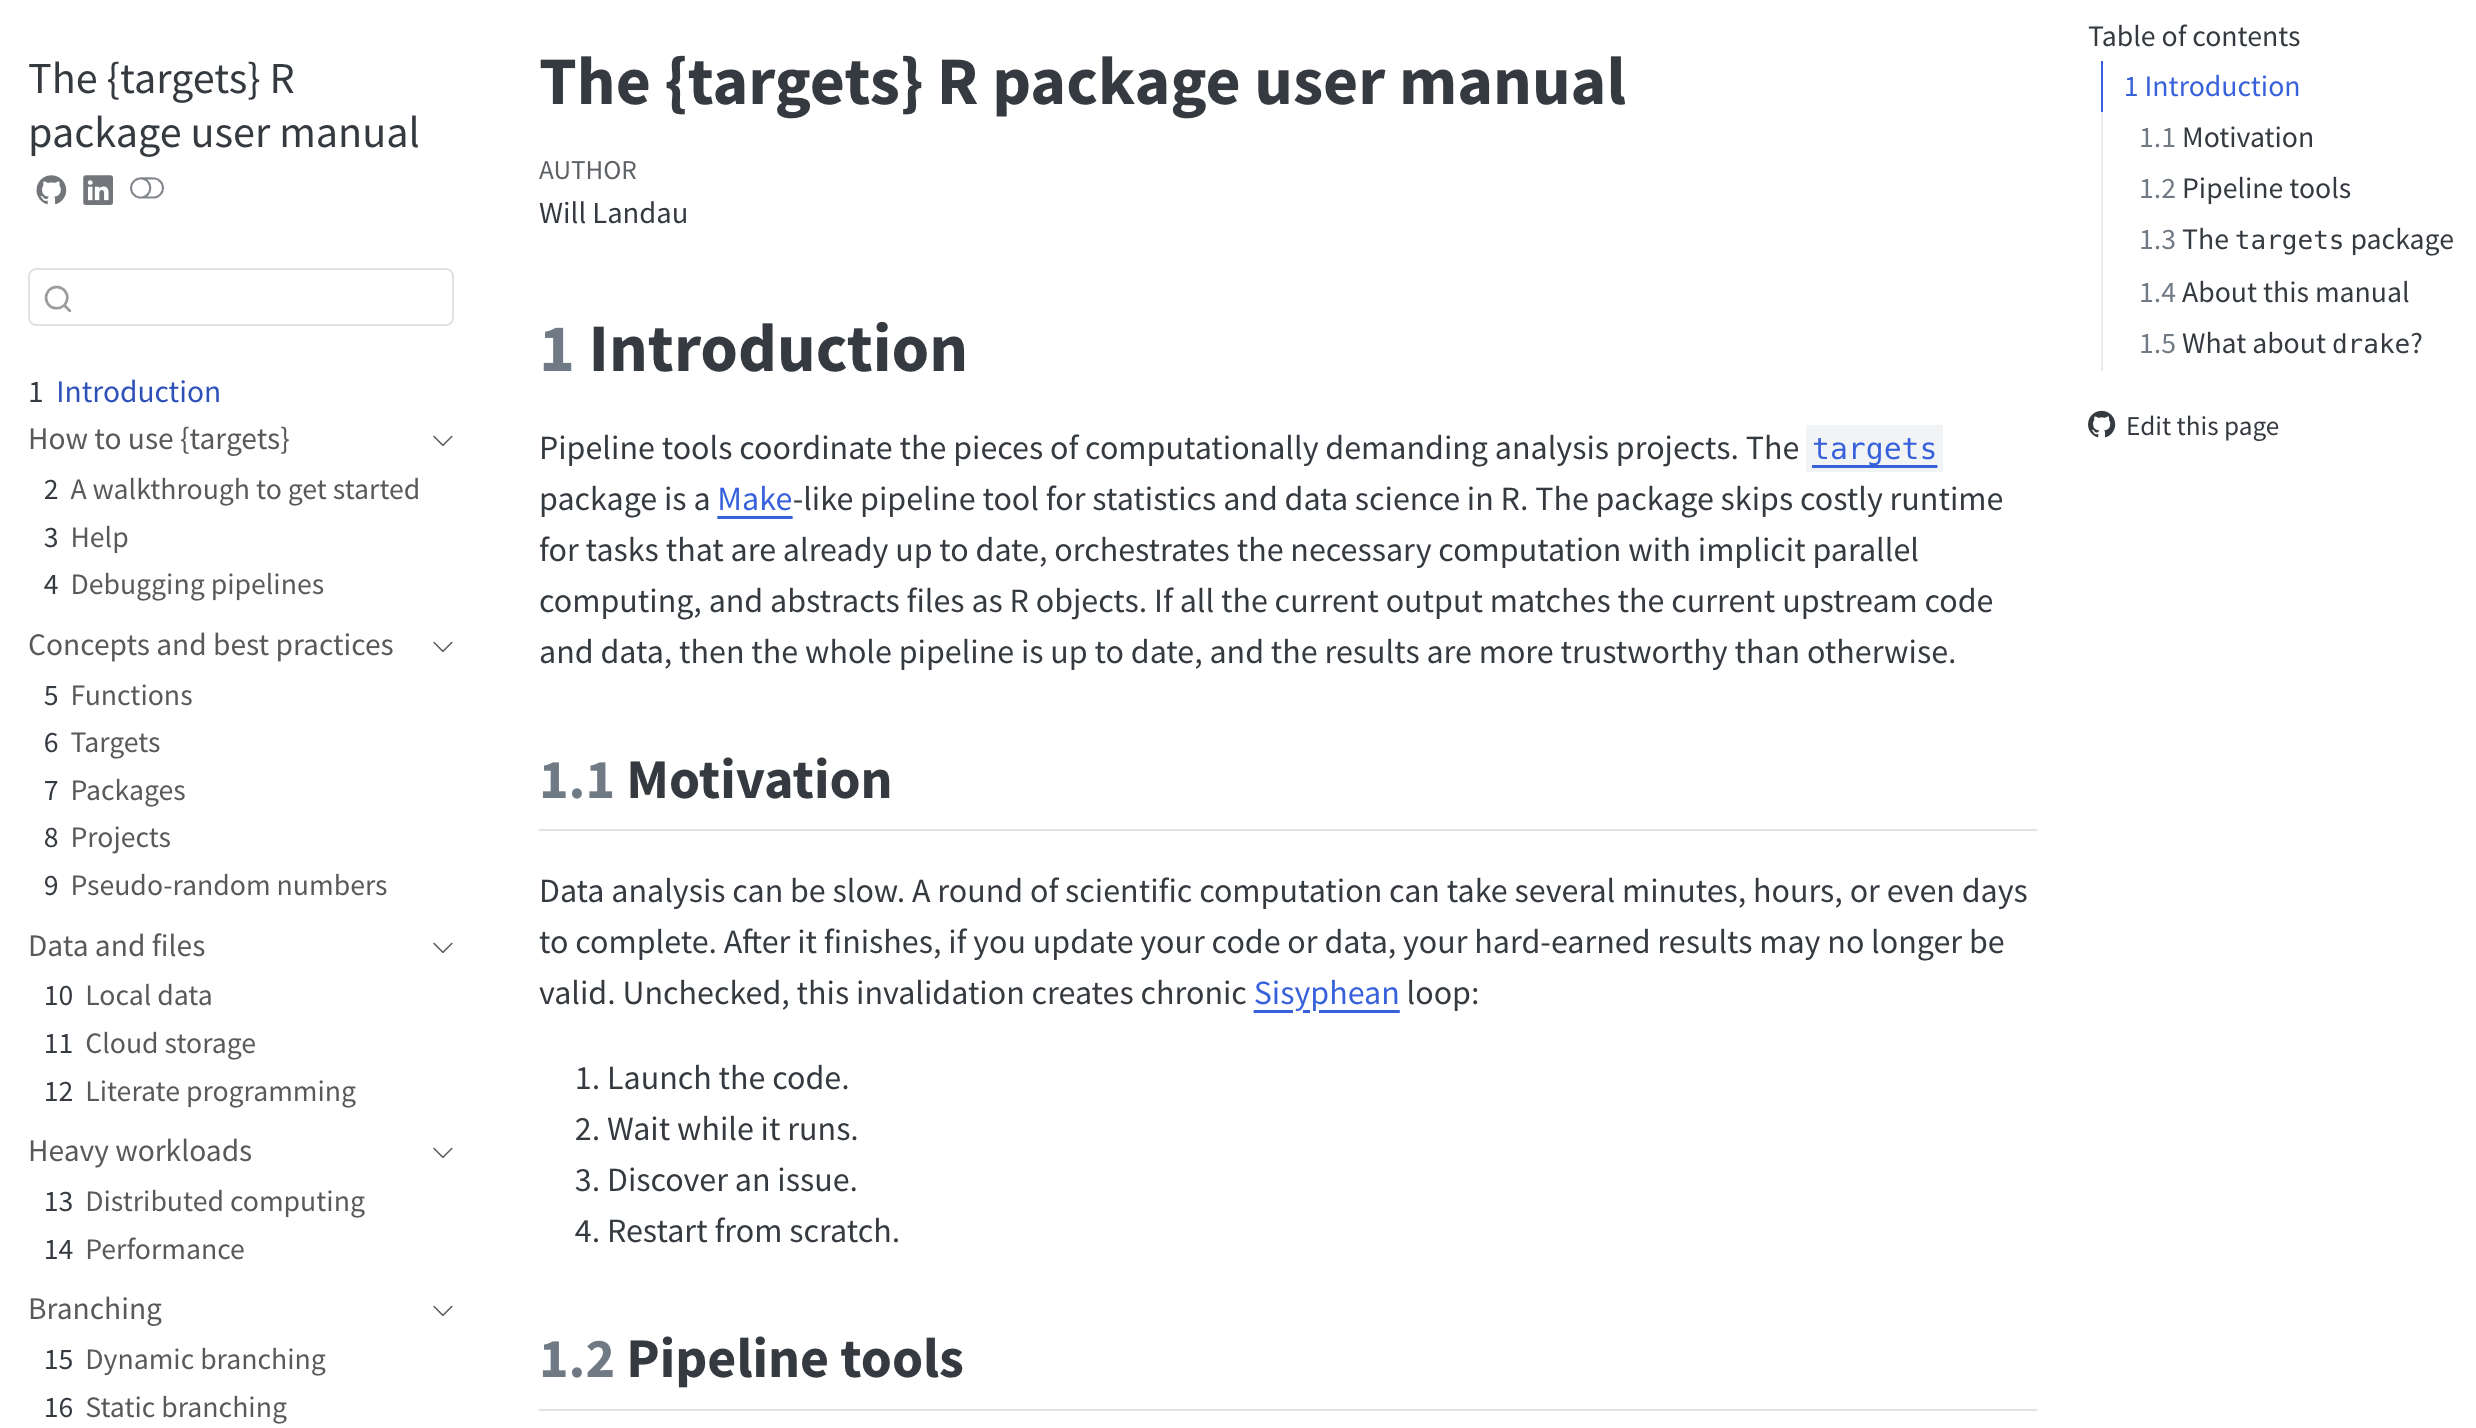
targets is a package that tracks what each step depends on and only re-runs what changed.
Instead of a sequence of R scripts, you have a sequence of targets that may or may not depend on each other:
Why targets?
Edit the figure and re-run – a slow model does not need to be refit. Change the raw data file and everything downstream knows it’s out of date.
It’s overkill for today’s tiny analysis, but worth it when steps are slow, numerous, or re-run constantly (I use it for simulation studies and for more complex analyses where the data is often changing)
targets
I gave a talk introducing targets a few years ago: https://www.louisahsmith.com/talks/2023-05-31/slides#/title-slide
The documentation is very thorough: https://books.ropensci.org/targets/
Split it up
Carve your working script into numbered pieces and save them into the appropriate directory:
R/00_setup.R–library()calls, read + clean the dataR/01_model.R– fit the modelsR/02_figures-tables.R– analyze the resultsrun_all.R–source()them in order- make sure you are referring to the file paths where they are saved!
Restart R and source run_all.R. Does it run cleanly?
Wrap-up
Before and after
Before: one file, hard-coded paths, hidden state, code out of order, results typed into Word by hand. Broke on the first line.
After: an R Project anyone can open and run from a clean session – paths that travel, code in order, tables and numbers that rebuild themselves, and a choice of ways to organize and report it.
The habits worth keeping
- One R Project per analysis; paths via
here() - Start every session blank; restart often
- Code that runs top to bottom in a fresh session
- Let a formatter keep the style tidy
- Pick an organization method that fits
On to Part 2
Your project runs and reports itself.
But code still breaks. Part 2: how to debug it systematically, and how to ask for help that actually gets you unstuck.